
Important note at the outset: the entire series is in no way intended to discredit the author of The Rational Male. Rollo Tomassi is an analyst trying to unravel the mysteries of male-female relationships. Anyone who thinks independently deserves our respect. Nevertheless, it is also incumbent upon us to correct possible misconceptions, especially when they are propagated by those who do not engage in independent thought. We also assume that Rollo Tomassi has an interest in finding possible misconceptions, even if they appear in his own theory, just as we have when they appear in our theory. This series serves as a contribution to a discussion that has been going around in circles for far too long.
For the sake of clarity, we will abbreviate age and gender (23F, instead of 23-year-old female), starting about halfway through this article.
Of all the concepts floating around in the Red Pill Manosphere, there are two major cornerstones that underpin the entire theory. One is the prevailing notion of male and female sexual market value and their relationship to each other. This article is concerned only with this cornerstone. We will deal with those built on it, such as that of the wall, in later articles.
Fortunately, Rollo maintains his own podcast to further expand and elaborate on his concepts presented in the book. Which is very commendable! Therefore, there is a nearly three and a half hour episode about the Sexual Market Value and its interpretation, so more than enough time to bring us closer to his intended interpretation. Here is the link to this episode: long version (3.5h) and short version (30min). All quotes from Rollo are presented here as such and as a Red Pill Influencer, he also gets the corresponding color:
„I will explain to you exactly, statistically, that this is true. I’ll prove this to you empirically”. – Rollo
And we promise to approach the matter with an open mind and to listen carefully.
“That’s the most operative point of today’s lesson, children. Take notes! Sharpen your pencils! I hope your pencils are sharp. I hope you guys are taking notes because this class is in session today!” – Rollo
All right, Mr. Tomassi! We are ready! In fact, we watched the mammoth lesson not once, but several times, and we didn’t just run through it either, but stopped almost after every sentence and thought about it non-ideologically, openly discussing and taking notes and googling and reading through every study mentioned and then discussing those. So more paying attention is not possible, mister teacher 😊
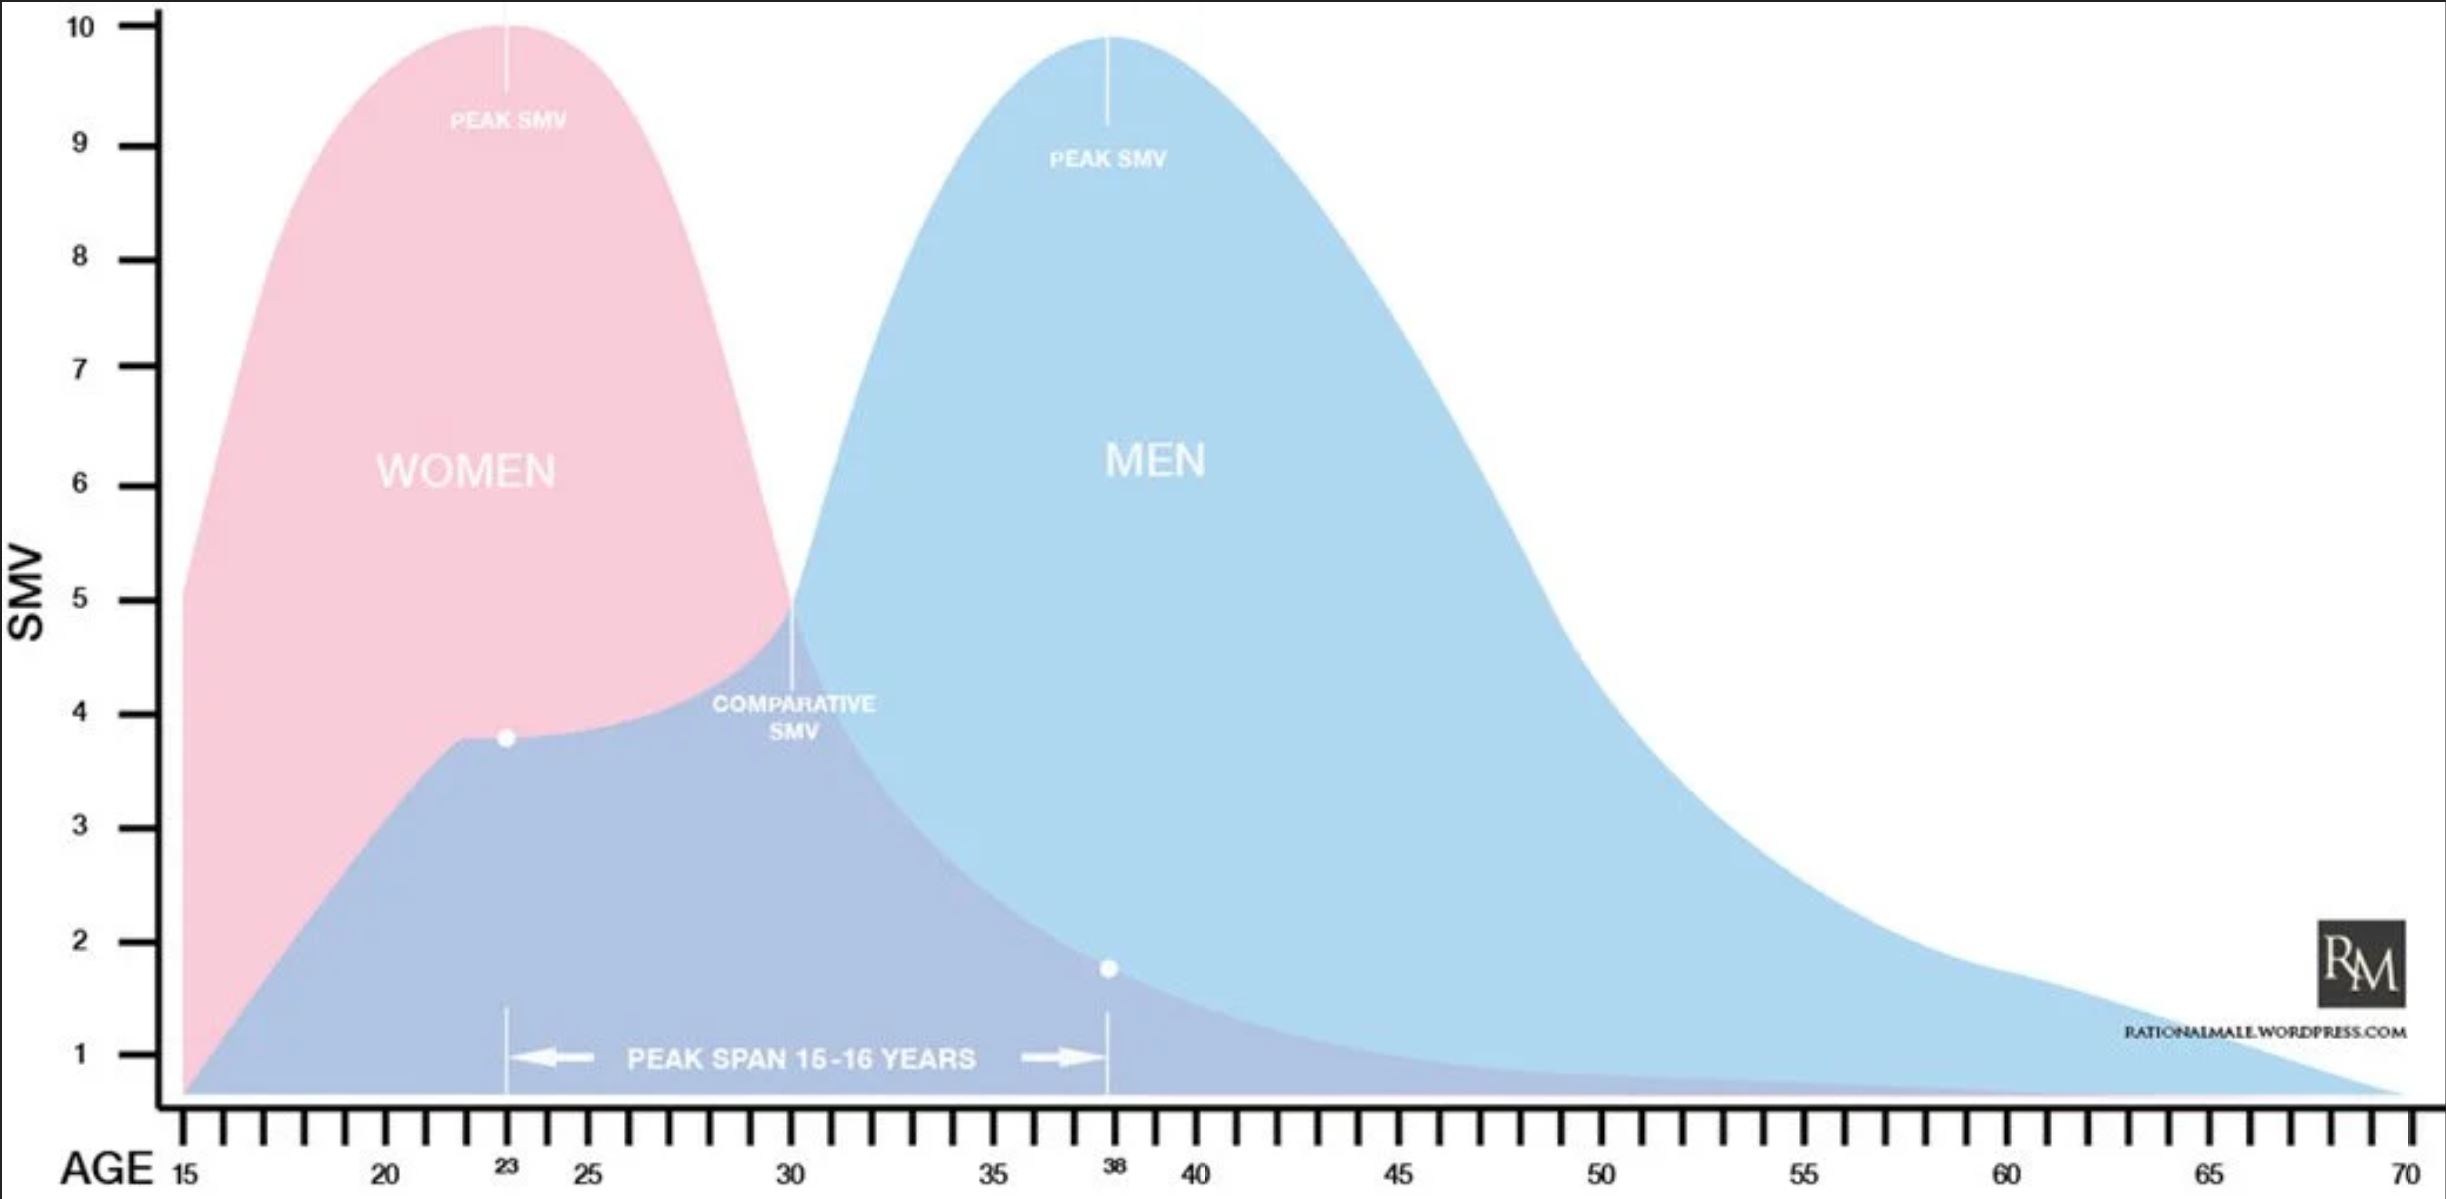
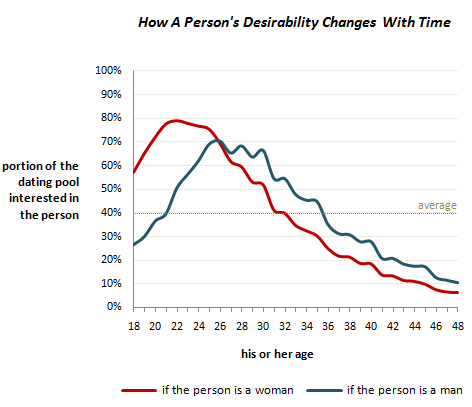
Let’s get started! Specifically, it’s about this graphic from his book:

This graph assigns a sexual market value to the sexes based on their age. There are extreme differences between men and women, with the relationship to each other always moving at a distance of at least sixteen years to sometimes several decades apart. Women therefore start with a huge advantage, but this drops off rapidly after the peak at the age of 23 and sinks into a bottomless pit as early as 30. Meanwhile, men start quite weakly and reach their peak at the age of 38. After that, their market value also drops again, but at a much slower rate. At this point, however, the woman’s market value is already so low that one would have to speak of “completely worthless”.
Rollo now tries to support this empirically with correlative sources. As the first such instance, he draws on the ancient Greek philosopher Aristotle, who, according to him, was the first “Red Pill Coach”.
Women should marry when they are about eighteen years of age, and men at seven and thirty; then they are in the prime of life, and the decline in the powers of both will coincide.
Aristotle
Unfortunately, Rollo only lets the quote speak for itself and does not go into more detail. That is why we are now catching up on this.
Not every wisdom is timelessly valid. Especially if millennia lie in between, one should look again at the environment in which it was uttered and analyze differences. So whoever brings up an ancient quotation as a supporting argument must necessarily deal with it and not just read it out, like: “Look, Aristotle said that too, so I’m right.” With the same method, one could pick any quote from history and present it as a correlation to one’s own theses solely on the basis of its utterance and the speaker’s institution. Unfortunately, Rollo does not elaborate on the quote, but slaps it on the screen as if that would support anything.
The ancient Greeks lived in an androcentric world. The rights and benefits of women at that time were severely limited and in many places were somewhere between a better slave and an animal. A free choice of partner was in many cases a luxury that women never enjoyed. The social and cultural ground of ancient Greece was so different from ours today that a transfer is doomed to failure anyway and can in no way be used as evidence for theories in a (according to Rollo) gynocentric high-tech world. Here apples are compared with pears.
The barely existing selection power of the woman had to be distributed on other factors like resources, protection, generally survival and not on alpha behavior or looks. Here, then, the completely different conditions that prevailed in antiquity are unreflectively transferred to the information age of the 21st century and built into the SMV graphic as a supporting pillar.
People did not live to be as old then as they do now. Only 40% of the people lived to be 30 years old. Only 20% even lived to see their 50th birthday. If one converts this to today’s life expectancy, the 37-year-old Greek mentioned by Aristotle is comparable to an old man of about 60 years today and thus already close to the end of his life. And here we come to the biggest problem in Rollo’s argumentation: if Rollo grants validity to Aristotle’s statement in the 21st century – that is, after all, the implied reason for using the quotation in the first place – then he must, of course, also adapt it accordingly to his SMV graph and increase the peak age of the man from 38 to 60, because that is precisely what Aristotle recommends! But Rollo does not do that! He simply takes the bare numbers and transfers them a few millennia into the future.
Also disregarded is whether this statement of Aristotle is true at all, even for that time. As with all thinkers, all that glitters is not always gold, and not all wisdom is correct. Why, then, does Aristotle recommend at all that 18-year-olds are a good match for men his age, most of whom do not even reach the recommended age? I suppose one has to consider that this statement, made by an old man, may not have been entirely altruistic.
Conclusion: the quote from Aristotle cannot be used in any way as a correlation to the SMV graph. In contrast, the way it was used gives little confidence in the next pillars of the SMV graph.
“It’s not about who wants who. It’s about who has the most of what the other wants (at that particular time in their lives).” – Rollo
It’s good that Rollo has described what he is trying to represent with his graphic and hopefully this will put an end to the different interpretations. Unfortunately, this explanation is the version of the graphic that makes the least sense: according to his SMV chart and this statement, there would have to be at least sixteen years to sometimes quite a few decades difference to find what you are looking for in the other. That is so far apart that it even becomes unmanageable for the man and an imposition for the woman.
According to this statement, a 23-year-old woman wants things that she is most likely to find in a 38-year-old man. In fact, however, the realities of these people’s lives are so different that compatibility is much harder to establish than with someone her own age. A woman aged 23 is probably in her party years and wants to have new sexual experiences, which cannot be said of a 38-year-old man. He would be much more suited to a woman in her early to mid-30s, who would also prefer to go out for a leisurely meal instead of spending the weekend getting drunk at student parties and making the nightclubs unsafe. The 23-year-old woman certainly doesn’t want children yet, while it’s high time for the 38-year-old man. A 25-year-old student is a much better fit for the Peak woman, after all, but according to the SMV chart, a 25M doesn’t have much to offer a 23F. That doesn’t stand up to any reality check! Surely there are couples with these age differences, there is everything in the world if you want to find something, but as a basic phenomenon 23F and 38M is an absolutely bad match! And in fact, such couples are extremely rare, although actually both are at their peak and both find in the other what they are looking for most at this time. Why then is this not also realized in reality? Because the SMV graphic has nothing to do with reality!
The SMV graphic becomes even more incomprehensible when you look at the fact that a 40-year-old woman finds all her wishes in a grandfather who is almost 70 years old. While she is still living life to the full, the grandfather no longer even goes to work and then talks to her about what? He is also no longer a suitable father, because the children won’t know him for long. Apart from the aesthetic difference, the physical fitness certainly leaves something to be desired and whether the man can offer this woman a fulfilling sex life is very questionable.
It is obvious that the age correspondences mentioned are extremely unfavorable for both sides – and in fact all other age recommendations of the chart as well: e.g. apparently a 15-year-old underage girl fits a man in his 30s, which would be criminally relevant in our modern times.
In addition, he contradicts himself here, because one of his following graphs shows that women just want a man two to four years older at the most (in terms of looks).
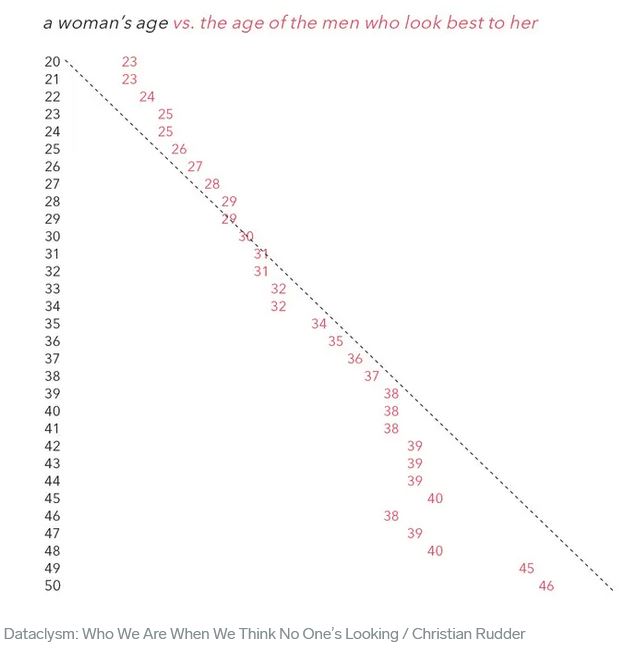
Admittedly, Rollo even emphasizes that this is only about preference in looks.However, this has several important implications: while one could assume before that the Red Pill philosophy still throws the looks on the scale with the peak value of the man – thus quasi presupposes that the man is also looksmaxed – this can no longer be claimed after this statement. Because this graphic – presented by the figurehead of the Manosphere – clearly shows that a 23-year-old woman finds a 25-year-old man most attractive, and for her a 38-year-old man must appear largely unattractive. But since, according to the SMV graph, she finds everything she is looking for in the 38-year-old man, this means at the same time that the manosphere assigns virtually no value to looks. Worse, the non-look-related “things she wants in a man” (whatever that is) must actually be so strongly present in a 38-year-old man that it vaporizes all the unaesthetic components. Thus, the manosphere has lost one of its argumentative retreats that looks matter. After such a statement, they willy-nilly have to justify any success or failure with their “game”.
At this point, we come to a graph that we initially skipped over, namely the average age of actors. Here, in fact, Rollo makes a correlation to his SMV graph, when in fact this is not the case.
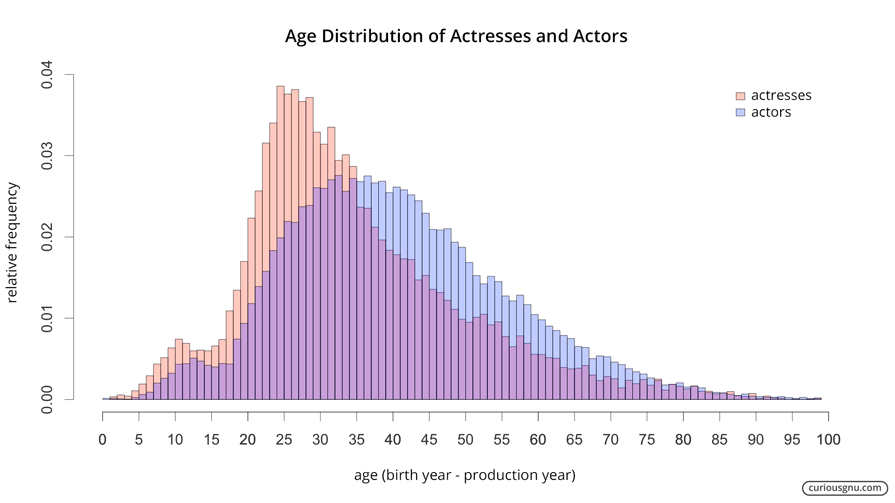
In fact, what the graph really represents is a woman’s attractiveness to a man, and that is consistently highest in her 20s, as the following graph confirms:
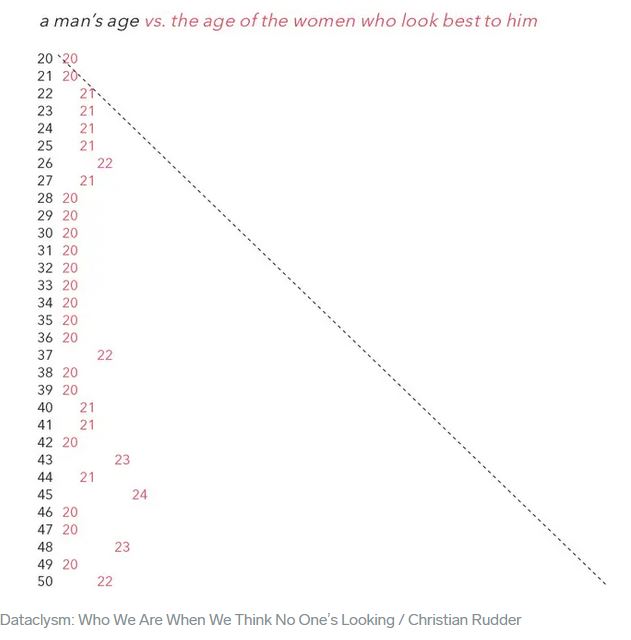
But wait! These two graphics presented are about looks, not about “who has the most of what the other wants”. That only makes sense if you admit that looks are probably the most important thing after all, but that would be Black Pill, and Red Pill not only rejects it, but even makes fun of it all the time. And we have also just established that the retreat “Okay, okay, looks do matter” can no longer exist for the Manosphere, unless you turn the world around to suit your needs.
The same Chameleon game takes place all over the Red Pil. The reason the SMV graph has so many interpretations is because it is like a shape-shifter: as soon as a statistic is useful, it represents that. If, on the other hand, it is attacked in that area, it suddenly represents a different meaning. A graphic is there to be able to grasp a certain statement at a glance and the SMV graphic speaks a more than clear language what is meant by it. But apparently the message of this particular graphic is so insanely complex that even several chapters spread over several books and an almost four-hour podcast are not enough to make sense of it. This is then either the worst presented graphic ever, or it’s the chameleon we think it is. In either case, the graphic is then completely useless.
“It’s not about who wants who. It’s about who has the most of what the other wants.” – Rollo
What is the difference between these two statements anyway? Let’s just take the peaks: 23F and 38M. According to Rollo, it’s not that a 23-year-old wants a 38-year-old (who wants who), it’s that a 23-year-old is looking for something that’s most common in a 38-year-old man (e.g., partying through the weekend, doing drugs, and hanging out at student parties). So she wants a 38-year-old man after all, if he has everything she wants. Where is the difference here? But even if someone can explain the difference to us now, we are convinced that no survey would show that 23-year-olds could find all their dreams in a man just before 40. After all, according to the SMV chart, a 25M has virtually nothing that a 23F needs (difference 10 to 4). In practice, however, exactly those come together most often.
The graph on aesthetic preferences shows that a 23-year-old woman would prefer a 25-year-old man. For the Black Pill community, this would prove that a 23F wants a 25M. The Red Pill community, on the other hand, completely ignores this, both the data collected and what you see when you look out the window. What is it about the 38M that is so magical, if it’s not about looks? According to the chart, a 38-year-old man is the preferred choice in terms of looks only for women over the age of 39 (!). Even Rollo knows that reality is completely different from the way he depicts it in his graphic: “who girls end up with […] usually it’s anywhere between three and seven years”. But then why is this not depicted in the SMV graphic, but something that contradicts this data?
„Sexual market value has a lot more to do with what does make a man attractive and at what age does that happen.” – Rollo
This interpretation cannot be represented in a single graph at all, because for each age category there are other things that are important to one in the other person. Completely different things are important to a 23F than to a 30F or 50F. And the 23F just does not find this in a 38M. For a 23F, the 25M has the greatest potential! She finds the 25M more attractive (much more attractive). She is much more comfortable with his stage of life and he is much more comfortable with her current stage of life than a 38M. Only in extremely exceptional cases does a 38M come into question for a 23F as the maximum “what makes a man attractive”. However, the graphic does not depict any of this, and is even completely off the mark, although it is supposed to depict potentials.
It doesn’t work in the other direction either: a 38M certainly doesn’t have the greatest potential for a 55F. A 38M only has the most potential for a woman in her 30s and this increases the closer the two get. In terms of looks, we’ve already established that the 38M is most attractive for a 39F. For everything else, it should not be far off as well.
The main problem is that nowhere is described what makes a man so insanely attractive and it must be at the age of 38 at the peak of expression. It’s definitely not looks that peaks; even Rollo himself has ruled that out. Perhaps his money? It can’t be, either, because first, the table would then have to be structured according to wealth and not age, and second, the male market value would then have to continue to rise. The same applies to status. Knowledge. Intelligence. Cosmopolitan agility. Or all of these together. The curve would then still have to continue to rise after 38, and all of the above can be obtained at any age. Perhaps then the desire for children? Men can beget at any age. What, pray tell, is behind the male SMV? With the woman it was also defined, because it is clear. With the man it remains a secret. It can’t be that half a dozen people look at three books and countless videos and still don’t know what causes the climax at 38. Instead, only graphs and quotes are presented without explaining why this constitutes male market value. The way it is presented and the way the SMV graph is read, the man’s market value is at its peak only because he has become 38.
Even in the manosphere it is perceived that way! There is no propagated strategy there, which one must apply and which then finally bears fruit with 38. Nothing! There is no detectable correlation between any proposal in the manosphere and age just before 40! For women, this is clearly present: if you are younger, your market value is higher because you look better and that’s what men are into, so work on yourself every day to look like 23. There is a clear strategy here. But if 38 is the peak for men, what is the suggested strategy there? One that is best started in one’s 20s and then blossoms only in one’s late 30s? Game? Anyone can learn that, they teach anyone, it’s age-independent or even more difficult in your late 30s than in your mid-20s. There’s nothing! The manosphere just saw “Ah! 38 is my peak. All right. I’ll just wait and see.” There is no strategy because there is nothing behind it! It is a mix of graphics taken out of context, randomly selected quotes decorated with misinterpreted data and the wishful thinking of older men.
“Children take notes! Sharpen your pencils! I hope your pencils are sharp. I hope you guys are taking notes because this class is in session today!” – Rollo
This statement shows the intellectual state of the Red Pill Manosphere. Rollo Tomassi seems to be the only person in the entire community who still thinks independently. The rest just sit and wait for input from him, diligently taking notes and then uploading their own video the next day parroting everything. Since Rollo is also aware of this, he addresses them as immature students. And beyond the Red Pill Influencers, it doesn’t get any better, as you can see from the comment sections.
„Between 23 and 38 is the comparative SMV“ – Rollo
To bring in a bit of reality, this statement is completely false. In fact, the male SMV is not tangential to the female SMV at any time and probably the least in this range. Here, elementary factors are left out, such as the relationship between supply and demand on the dating market, or the female selection primacy, or all the data he himself presented about looks (not to mention the data about looks that the Black Pill might present, but we’ll leave that aside). Likewise, all statistical surveys of real results are ignored. Any simple Tinder experiment would disprove his statement. For a man of this age to keep up with an average woman (SMV5), his SMV probably has to be 9 or more. As an SMV5 man, on the other hand? Good luck.
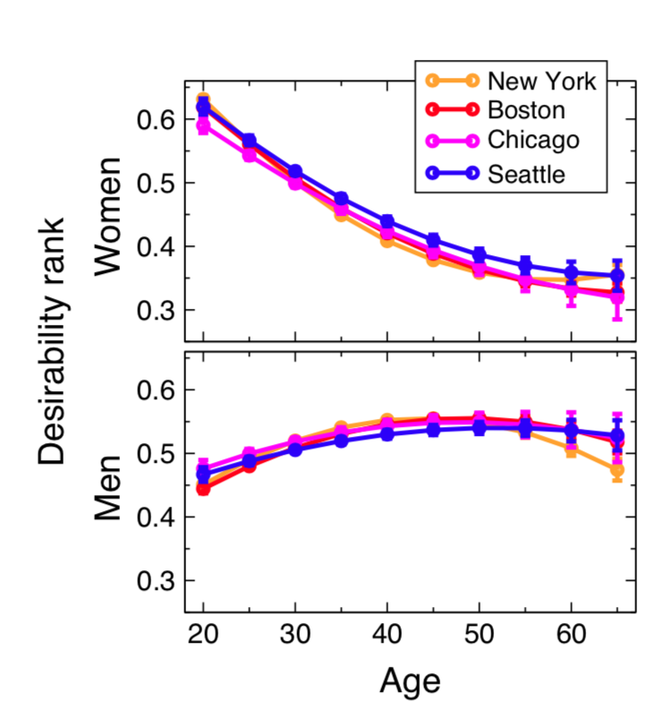
The next chart presented by Rollo is again to be used as a correlation to confirm his SMV chart because it is said to have a striking similarity:
First of all, this data is from 2010 and thus outdated. The first real smartphones hadn’t been on the market long and weren’t that common. Many of the big dating apps came after that: Tinder and Hinge in 2012, Bumble in 2014, etc. Since their emergence and widespread distribution, a new age has dawned in terms of dating and this must be taken into account.
But even leaving that aside, the graph shows something quite different from Rollo’s SMV graph! Here, a 37-year-old man is on the same level as a 35-year-old woman! But in his SMV graphic, the female counterpart is 23! That’s a difference of 12 years, and not in any aspect of the graphic, but in the peaks, which is the central argument for the camel hump graphic. The rest is also completely different here: although the desirability of the man (in 2010!) is higher in the later years, it is only slightly (e.g. 44F = 47M). The two lines actually run very close together, while in Rollo’s they are decades apart. Of course, a woman has more suitors in her younger years and she prefers a slightly (!) older man, but even in 2010 we can’t see a “wall” that doesn’t affect the man equally.
What OKCupid’s graph also doesn’t show is “who has what the other person wants“, but since (according to Rollo) this is exactly the only true interpretation of his graph, it wouldn’t make sense to show this OKCupid data, because irrelevant. So what now? Apparently, the meaning of the SMV graphic changes depending on the strategic need for argumentation. For us, this hair-thin differentiation between “who wants who” and “who has what the other person wants” is too small anyway, and in addition it is not applied consistently. As needed, one switches between different interpretations like in a shell game.
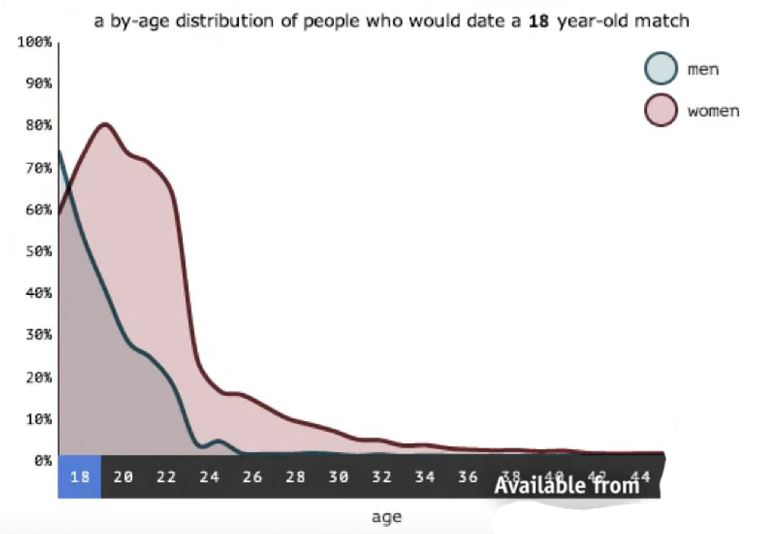
The next graphic is about who (man/woman) would date an 18-year-old match at what age. Rollo claims: “This looks very similar to [my SMV-Chart]“. Decide for yourself:
Sexual Market Value (SMV)
Come on. Even without knowing anything at all about the graph or what is shown on it, anyone can see at first glance that these are two completely different curves! If THAT is enough to be used as evidence, then anything is enough. Then I can now drag up absolutely any graph and say “this looks similar to this“. Holy cow!
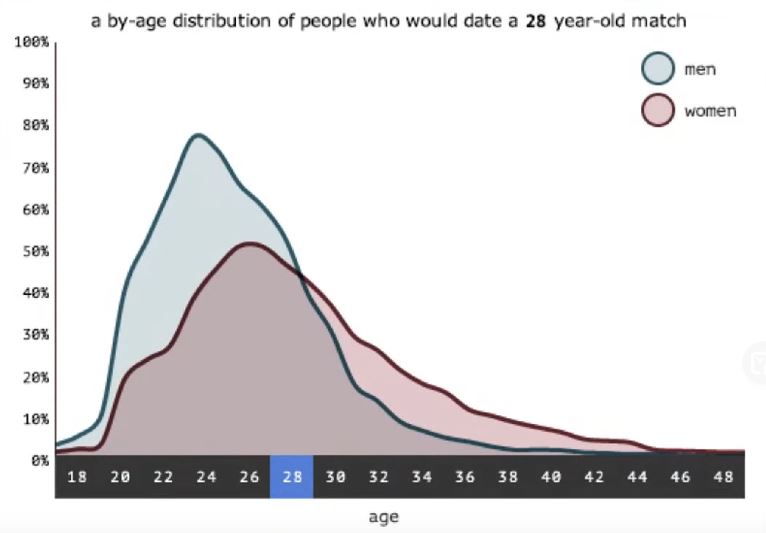
Also in terms of content, this new graphic has little to do with the SMV graphic. Already for a 24-year-old man, 18-year-old girls are too young to date here (only 20% would do it) and from 28 on, it is only 10%. What we read from this: a young woman may look the most attractive to a man of any age, but for actual dating (and this is all about potential) he prefers someone closer to his age. So for a 28-year-old match, it looks like this:
OKCupid-Data Rollo’s SMV-Chart
80% of women would date a man 4 years older, according to this chart. Yes, four years! Not sixteen! Where is the similarity to the SMV graphic here? If you increase the age difference by just another two years to a six-year age difference, only 60% of women are still interested. An age difference of 10 years: almost 0 percent! These data actually refute the SMV graph rather than support it. Why is this presented as a pro argument? Because the same colors were used?
The next graph is again presented superficially: “look, the female curve goes down, the male curve goes up, so I’m right.” No analysis, no explanation. Any student working like this would not get past the first semester.
The way this graph is presented, what it really says is this: how attractive is a person to the counterpart of the same age. Any other interpretation (e.g. look, the female curve goes down, the male curve goes up) would mean that a man at 70 is more attractive to women than at 25, which would be ridiculous. But that is exactly what Rollo presents this graph as! Just because the man on this graph has the highest value at 55 and thus has it easier in the 55-ish category than a 20M in the 20-ish category, doesn’t mean that a 55M is also attractive to 20F, 30F or 40F. It is only about his own age group.
Ok, so since Rollo is using this graph and it only serves as a useful correlation for him if you just look at the up and down curves, we have to assume that he wants his SMV graph interpreted this way too because otherwise he would say 70 is more attractive than 25. Let’s do that: So we are now analyzing only from one’ s own age category.
So a 38F has absolutely nothing to offer to a 38M? (SMV 10 vs. 2). Let’s go down a bit: even a 30F doesn’t seem to be a good match for a 38M either (SMV 10 vs.4). Seriously? These statements do fail any reality, both personally (look around at how couples in any area are age-wise) and statistically (the vast majority of 38M in relationships are with women in their 30s), as well as by their own preferences (see our analysis on the previous graphs presented by Rollo himself). Maybe Rollo means which women are most attractive to a 38M? Then we are back to the 23F and this has been discussed here before that this would not be a good match, for either side. No matter how you slice it, the SMV graph makes no sense.
His next graphic is about the risk of dying before his partner and has absolutely nothing to do with any SMVs. Why was it used at all?
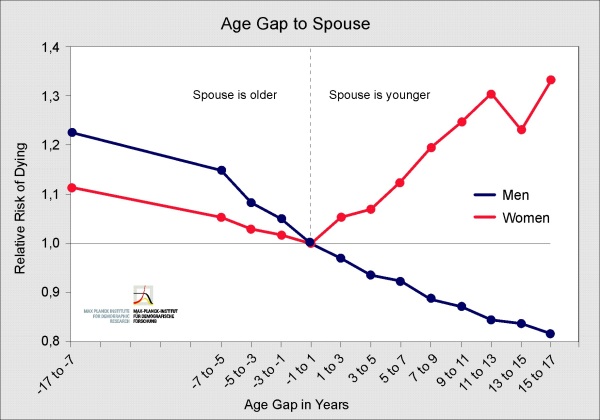
Apparently, it is now enough if any male/female curve just looks different in some way to abuse it as a correlation to the SMV graph. But since we googled and read this study anyway, here are important numbers again: in the US, married couples are just under 2 years apart. If you go by the SMV chart, however, 2 years difference is supposedly not a good match. It must be 16 years.
The graphs that follow are similarly irrelevant, namely about the risk of divorce at what age (yes, people want to have kids in their 30s, which is why it’s lowest there) or the average wedding age: men 29 vs. women 28, wow. Or in England: men 31, women 30. How does this support the SMV graph? It completely refutes it by clearly showing that people largely prefer a partner of their own age, so that partner has the most SMV for them.
From here on, it was clear to us that from now on only straws would be grasped and that the main guns had already been fired. However, since we have discussed and clearly refuted all of them here, they were probably just blanks after all.
Conclusion
The SMV graph from The Rational Male makes absolutely no sense. Neither is it supported by data collection, nor does it reflect how people behave in the real world, nor does it respect what people state as their preference. The justifications on which it is based are all either taken out of context or actually even refute it, so that no sustainable foundation is discernible.
In addition, the statement of the SMV graph is constantly adapted to the respective circumstances: if it fits for graph A, the SMV graph means interpretation A, and for graph B it is interpretation B. The same game is played when the graphic is attacked, because whichever interpretation is attacked, it is then retreated to that the other interpretation was meant. In any case, even this is only a cat-and-mouse game that delays the inevitable: in the end, Rollo Tomassi’s SMV graphic doesn’t stand up to any interpretation.
„Of all the topics, this is the one I’ve done the most homework on.” – Rollo
Well, then we are looking forward to the other topics….
Title Graph is from The Rational Male. All other graphs have been referenced accordingly.

Author: Severin
Author of "Black Pill Dating"


